
Last night, I released the Kings of War Army List Big Datadump, a database containing an itemised breakdown of 297 army lists across 12 different events.

You can view it here.
You can download it here.
This file has been generated by a Python script I’ve written which trawls through folders of EasyArmy PDFs and generates the breakdown of the units, upgrades and artefacts for each file. This will be released open source shortly, and I intend to create further releases of the datadump when I get PDFs from more tournaments.
Why create the datadump?
While we can plot how well armies are doing as a whole according to tournament results, getting anything more granular such as specific units being taken or whether certain unit types are overrepresented has been a mystery. We often have the EasyArmy PDFs but they have to be looked at manually meaning that often what’s considered good or not is generally a matter of opinion.
With a datadump like this, we can analyse the data and draw out definitive statements about what is and isn’t working in Kings of War. This can be used to analyse the meta, develop counter-meta lists and will be a useful tool for the RC when it comes to balance updates.
There’s so much insight we can get from this data that every time I answer an intriguing question, it uncovers even more questions. There’s likely going to be more blog posts as I dive into the data. For now, I’ve locked my data exploration spreadsheet and sticking to what I’ve uncovered so far.
A couple of notes on terminology
Placement
We’re quite interested in how well lists perform so I will often be referring to the Placement of a list. This is a value between 0 and 1 and shows how far up or down the leaderboard the list ended up, where a list with a Placement of 1 won the tournament and a list with a Placement of 0 came in last.
Upper, Middle, Bottom Quartiles
Lists have been categorised based on their placement into the Upper, Middle and Bottom Quartiles. The Upper quartile covers lists that placed in the top 25% of each event, the bottom covers the bottom 25% and the middle covers everything in between.
Per 2000 Points (Normalisation)
Values are often stated as being “Per 2000 Points”. If I were looking at the average unit strength per list, having some lists at 2000, others at 2300 and others at 1600 would skew the results. To make them comparible, I’ve raised or lowered the affected values so that they’re on a Per 2000 points basis. A list that’s 2300 points would have its total unit strength multiplied by 0.87 to compare it to a 2000 point list.
This process, plotting data so that it’s on a comparable basis, is called Normalisation.
With all that out of the way, let’s get started.
Unit Strength
Let’s start with a simple one. Unit Strength. It’s a debated topic as to how much Unit Strength you should take in a list, so let’s see what effect Unit Strength has on how well a list does.

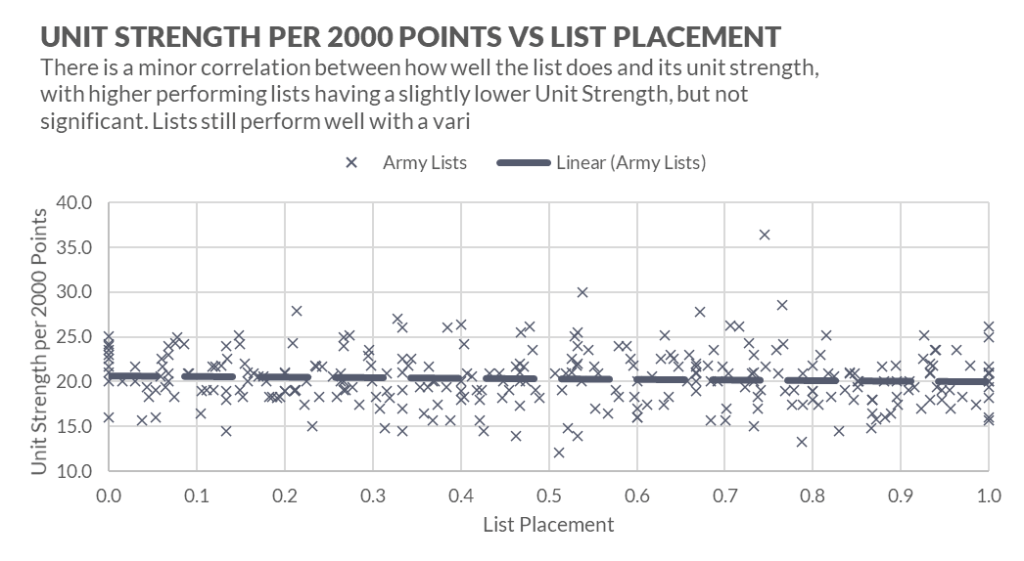
Not much, is the answer. There is a small trend of lower unit strength performing better, but it’s not particularly significant and there’s still a wide range of unit strengths at the upper end of the placement board. Lists with between 15 and 25 unit strength per 2000 points perform at all levels.

Unit Strength scales fairly linearly with point level. Players don’t take a disproportionate amount of Unit Strength at lower or higher point levels. It’s pretty consistent that players take around 20 total Unit Strength per 2000 points regardless of the points level.
Unit Spending
For this section, the unit cost is the baseline cost of a unit, excluding any upgrades or artefacts.
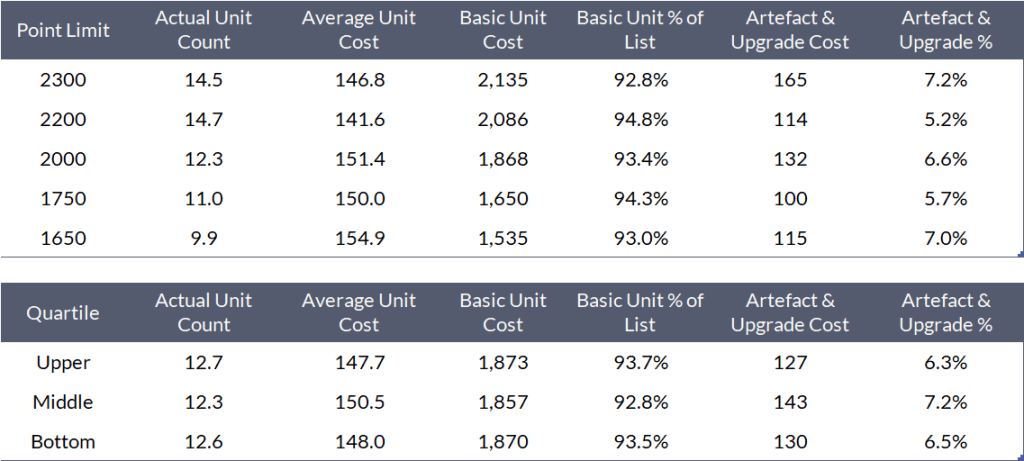
The proportion spent on units vs upgrades & artefacts does not appear to be significantly affected by either point limit or performance. Around 93% of your points spent on units with the rest on upgrades and artefacts appears to be the norm.

There is a healthy range of lists above this, so as long as you don’t spend more than that, you should be fine.
Special Rules
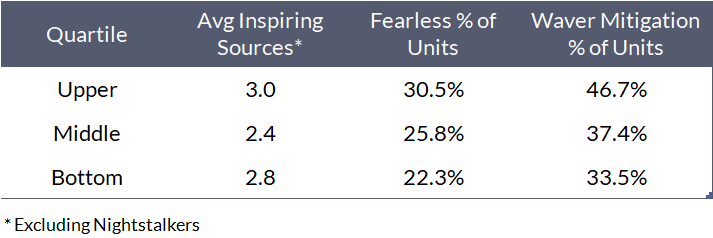
3 Inspiring Sources per 2000 points for upper lists. Middle lists? Pull your finger out and get better Inspiring coverage. Note that this excludes Nightstalkers and includes Inspiring, Very Inspiring and the Inspiring Talisman.
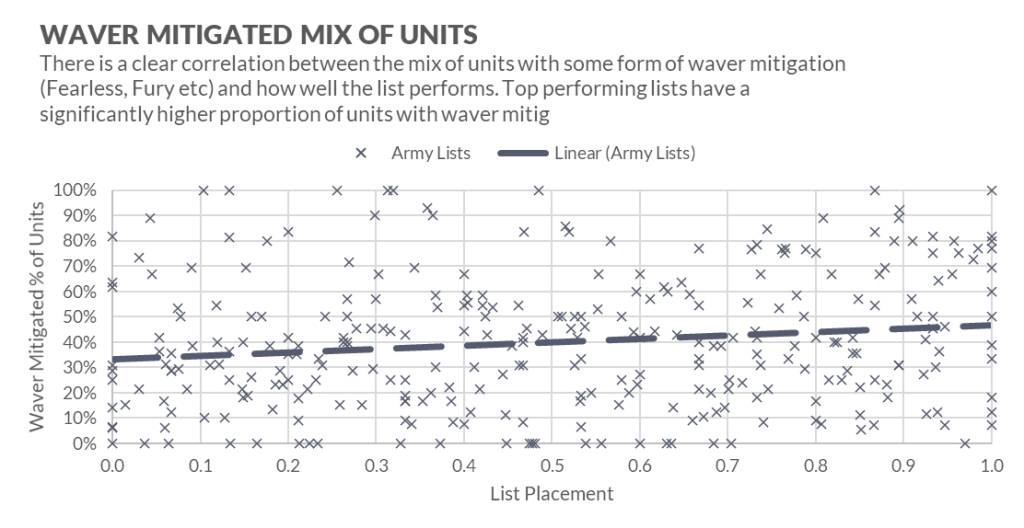
Fearless and Waver Mitigation (Fearless, Fury, Headstrong and the Staying Stone). Wow. Strong correlation between the amount of Waver Mitigation in the list and how well it performs. This was always suggested by tournament players, but here it is in black and white.
Faction Rankings
Here it is. The one you’ve been waiting for. I’ll give you a guess which faction comes out on top.

If we then have a look at what proportion of each faction’s results are in the Upper Quartile, a similar picture appears.

Undead are, again, the top where we have 10 or more results, followed closely by an Undead variant. If we include all factions regardless of how many results we have, Undead and variants make up three of the top five.
Of those we do have 10 or more results for, Elves perform the worst with just 6.3% of their results in the Upper Quartile (1 out of 16). They are also the worst performing for placement at 0.44 – equivalent to an average of 56th place in a 100 person event.

We see some unsurprising figures when it comes to Unit Strength with Ratkin Slaves leading the pack at Unit Strength per 2000 with 26.3 and Order of the Brothermark with the lowest at 15.3. There are some surprises in there such as Dwarfs at the upper end with 22.6 US per 2000 points – though having seen some of the Dwarf lists that Elliot’s pumping out recently I’m not as surprised as I would be.
Artefact Usage
The table below displays what percentage of lists used each artefact, sorted by how popular each one is in the Upper lists.

In a surprise to absolutely no-one, Donald Trump is a fascist.
And also Maccwar’s Potion of the Caterpillar is the most popular artefact by far.
Bottom lists? Use the Potion of the Caterpillar.
Here are some interesting callouts:
- Inspiring Talisman: This is used significantly more by the Upper lists (32%) than Middle & Bottom (23% & 21%), suggesting that Upper lists will often use specialised heroes such as spellcasters and give them the Inspiring Talisman, rather than taking a unit that natively has Inspiring such as an ASB.
- Conjurer’s Staff: This is not used by top lists as much (13% vs 17% and 19%), again suggesting that the Inspiring Talisman is the artefact to go for if you have a wizard.
- Mournful Blade and Blade of the Beast Slayer: These are used significantly more in upper lists, suggesting that having a dedicated hero or monster hunter in your list is a good way to go.
- Lute of Insatiable Darkness: This is used far less in Upper lists and even then it’s only 18% of all lists. This one surprised me because it often felt that most lists I face have this. I don’t know if this has changed since 2nd edition but it’s definitely not as auto-include as some online talk would suggest.
- Trickster’s Wand: Used more in upper lists, suggesting it’s a good one to throw on the odd ASB. It’s almost as popular as the Lute.
The 5 point artefact mix is interesting to compare:

Upper lists are far more likely to use the Staying Stone than middle & bottom lists, adding to the whole waver mitigation = stronger story from above.
So, if you have a spare 5 points and don’t know which artefact to grab – waver mitigation it is.
So I should just play Undead with exactly 20 Unit Strength and 3 Inspiring sources in 2000 points, right?
No.
I don’t want anyone to walk away thinking that this article lays out precisely what you must craft in order to win. It’s simply exploring what has been working so far but you’ll notice that in every piece of analysis there are plenty of examples that buck the popular trend. Unit strength ranges from 15 to 25 per 2000 points in the upper quartile – that’s a massive range to play with.
What this might help you to do is develop a counter-meta list where you look at what’s popular and come up with ways of beating that. Though admittedly, that pretty much means just taking Undead to fight Undead. If anyone can think of a way of overcoming Undead’s built in points discount then I’d love to hear it…
Leave it there… for now
I can keep going. So much data to go through, and this is with just 12 events. Everything that I’ve looked at has sparked more questions that will have to wait until a later article.
If you’re interested, you can download my working book used to generate the tables and charts here.
Coming up soon will be the release of the Python script to parse EasyArmy PDFs. It’s unlikely to be an executable so you’ll have to have a Python interpreter installed so you can run it.
I supposed I should also finish off the “Year in Review” articles, too.

Amazing work. Many thanks
LikeLike
Very very good article. It’s also interesting to see the disparity between the numbers of each race taken.
LikeLike
Interesting data but the random political take was retarded and makes you look like an asshole.
LikeLike
Awww… did someone’s favourite fascist fail to win an election?
It’s my personal blog. I’ll make whatever political comments I like, and if they make me look like an arsehole to seditious fascist supporters then all the better.
LikeLike
Hi there,
tabletop tournaments probably has a bit more data for more countries than you with surprising results, in particular the elves rank in the top of the ranking…
https://www.tabletoptournaments.net/game/Kings-of-War
LikeLike