

I’ve seen more and more people questioning whether the dice rolls in Universal Battle are fair, or whether they are biased in some way. This has led to the #UBDice meme in the Kings of War community whenever someone has a particularly hot or cold roll, and others discussing whether to start hand rolling dice on webcam instead of using the in-game dice roller.
There are four common concerns in particular;
- Are the dice giving an even spread of 1-6?
- Are Nerve rolls (2D6 for non-KoW players…) too extreme?
- Are the dice rolling more extremes than physical dice?
- Are the dice rolling sequences of extreme hot/cold rolls?
I started a poll in Fanatics, asking if people have the perception that UB dice rolls are skewed in some way.

I tried to make the distinction between a true random number generator and pseudo random number generator (explained in more detail in the data collection section below), and stated that in this case “truly randomised” = pseudo randomly generated.
Now the majority of people replied that they felt that there was a skew, even if it’s not significant.
Well, I’ve recorded the UB data.
I’ve analysed the data.
I’ve done comparisons.
The TL;DR:
I can find no evidence of bias, extremes or sequential extreme rolls within UB dice.
I’ll even go one step further;
UB Dice appear to be less biased than physical dice, though not to any level that could be distinguishable by human perception.
The perception that there’s something wrong with the dice rolls appear to be down to some sort of bias on the observer’s part – probably a mixture of confirmation bias, how the information is presented and the bandwagon effect.
So. Time to show my workings and more detailed answers. The first section of Data Collection is a ton of caveats and detail about how I went about collecting the data (surprisingly). You may feel like skipping past that and straight onto the questions later on – I won’t be insulted!
Data Collection
Unfortunately, at the time of writing, I could not find any way of automatically exporting dice rolls from Universal Battle. While they show up in the chat box, they don’t appear to be copied when you try and copy the chat into an external program. You can’t select the text and copy/paste it into another document.
While the entire chat log would be in plain text, I’d be able to process that plain text and write a macro to sift through and extract the rolls. Unfortunately with no way to export the text, and my knowledge of automated image scanning and processing lacking, I only had one option;
Manually write down the results.
I watched four games from the Dash28 Live Battle Reports playlist and entered the dice roll results into a spreadsheet. I was able to fast forward through the reports and watch for the telltale purple messages in the chatbox indicating a dice roll.
The four games I watched were:
- Chris Fisher vs Cyle Pool
- Dan King vs Jeff Traish
- Marc Taylor vs Michael Pearcy
- Mark Campbell vs Mike Szedlmayer
I’d initially intended to go through each of the 16 published live battle reports (at the time I started) but as you can guess it got old very quickly. It took me an hour per battle battle report to record the results and already the data was conclusive. There wasn’t any point to collecting more.
The dataset can be downloaded here
Error Rate
I will have typed in some numbers wrong. I guarantee it. I caught myself doing it a couple of times and corrected it. To try and reduce this issue, I added a column (F below) which added up the numbers of rolls I entered in columns G:L. After entering the numbers, I made a quick check to make sure that the total I’d entered matched the total rolled. This would eliminate many typos and did catch a couple of them.
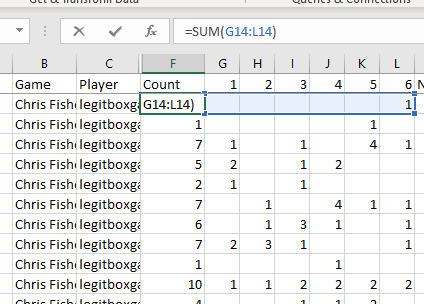
“Column Bias”
One of the issues that I again caught myself doing a few times was writing numbers in the wrong column – specifically for some reason not moving the cursor from the “2” column to the “3” column. If the roll was a 1 and a 3, I would write in a 1 and a 2 instead. I caught myself doing a few times early on so knowing that I’d made that mistake I was able to be more aware and stop it a few more times.
Early on in the dataset two does come up as more likely to be rolled than any other number, and I wonder how of that is genuine and how much is my erroneous data entry.
Regardless, due to my awareness of this bias, the Count column making a very simple checksum, my experience in general with data analysis (a depressing amount having been devoted to data entry) and a high likelihood of data entry errors cancelling each other out I do not believe that this has had any substantial impact on the results.
I mean, if you want to spend an hour per game writing down dice roll results then go for it…
A note on Pseudo Random Number Generation
Computers can’t generate true absolutely random numbers. Most computer driven random number generators, including UB’s dice rolls, are what are called pseudo random number generators. They are considered random enough for the overwhelming majority of applications. It’s only when you get into things such as cryptography that you need true random number generators.
Really what we’re looking at is whether a human can tell the difference between a true random number generator such as D6’s (which aren’t truly random, for other reasons explored later) and UB’s dice.
I started a bunch of polls on Fanatics where I had 4 sets of data – one from UB and three from random.org’s true random number generator. I asked Fanatics to see if it could pick out which one was UB and which ones were the true random number generated datasets.
The polls are still running but the answer is no. No they can’t tell the difference between UB dice and True Random Number generators.
Anyway. Onto the analysis side.
Are the dice giving an even spread of 1-6?
Yes. To the same extent that a random number generator does.
Naturally the fewer dice rolled, the more spiky and less average the results will be. The more dice you roll, the more than spikes are evened out and you move towards the average.
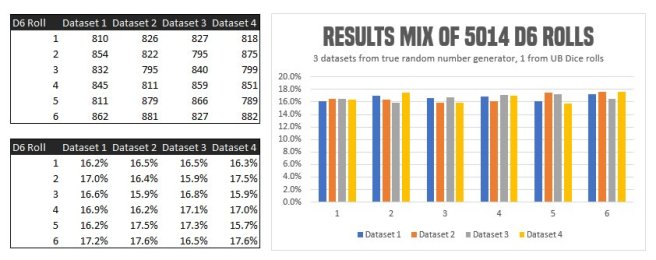
I have 5692 D6 rolls recorded in total across the four games, but decided to use a relatively round number closer to 5000. The best match was 5014 (since the final roll had 18 dice). I grabbed three datasets of 5014 random numbers between 1 and 6 from random.org. I posted the image above into Fanatics where it compares the four datasets in total to see if people can pick out which one is the UB dice and which ones are the random number generator.
It’s dataset number four.
The majority of people chose dataset number one.
Now the UB dice set does have the biggest Range (difference between highest and lowest) at 1.9%, but the second highest range is only 1.7%. I’m sure if I refreshed a couple more random.org datasets I’d get some that are higher than 1.9%. Even if not, I cannot believe that any human being can perceive a bias of less than 0.2% over the course of 5,000 rolls.
0.2% is not significant. I only compared it to three random datasets. Even if you were to say that 0.2% was a bias, it is nowhere near significant enough to impact anything.
So yes, the dice are giving an even spread of 1 to 6.
Are Nerve Rolls more extreme?
No.
Answering the first question should be sufficient for this, but there’s a potential argument that for certain pseudo random algorithms there might be a potential for lower numbers generated = higher spikes.
So I did it again.

I posted the above graphic to Fanatics where it compared the 302 2D6 rolls in total in the UB dataset to 3 datasets with 302 2D6 rolls generated by random.org, and asked people to guess which one was UB dice and which ones were random.org generated.
Did they guess right?
Did they bollocks.
At the time of writing 8 people have guessed Dataset 1.
3 people have guessed the correct dataset, number 3.
Dataset 1 is an interesting one because it does have that dip for the 6, but that’s just emphasising that even at 302 results, those dips and spikes can still occur.
Now I did record pure Nerve rolls in the games rather than just 2D6 rolls, and comparing just the nerve to 2D6 overall gives us a good example of how more rolls = better.
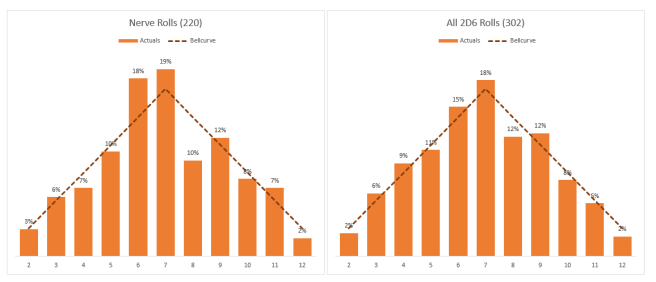
With just the nerve rolls, there’s still a ton of variance compared to the bellcurve. Even at 220 it’s not enough to be consistently following the correct bellcurve. Increasing to 302 makes the data more robust.
UB has no idea what is and isn’t a nerve test, so it can’t possibly be biased towards nerve rolls. As far as it knows any 2D6 roll is the same as any other 2D6 roll.
So. when you compare to a true random number generator, UB dice do not give extreme nerve rolls. What may be throwing people off is just how many nerve rolls you need before the totals start tracking close to the bellcurve. If you’d have asked me before I started this, I probably would have guessed around 200 to start getting consistent results, not 300.
This doesn’t explain why people feel they’re more spiky than physical dice, but the perception is not accurate.
Doubles
On a side note, I saw someone somewhere comment that UB dice appeared to roll more doubles than normal for nerve rolls. Not true according to my data.
Of the 220 nerve tests, 32 were doubles which amounts to 14.5%. Mathematically given enough results this should be 16.7%. So no, doubles are not being rolled more often.
Are the dice rolling more extremes?
No.
To measure this I tracked the percentage mix for each dice value (% rolled 1, % rolled 2 etc) over the course of a game. Then I calculated the Range, which is the highest value minus the lowest value. The higher the range, the more extreme the rolls have been. The lower the range, the less extreme.
Again, you guessed it, I posted it to Fanatics compared to three random number datasets and asked people if they could pick out the UB dice set.

Well I think people have had enough of my shit and see where I’m going with all this, so only three people have responded to the poll. Of those three, only one person guessed correctly that the UB dataset is the blue line, number one. Mr Tom Elohi-Runs-From-Imps-And-No-I’m-Never-Shutting-Up-About-That Annis. I asked him why and…

Ultimately the UB dice stayed well within the ranges established by the other three datasets. If UB dice were generating more extremes then you’d expect to see it yo-yoing up and down, and it just isn’t. Honestly if anything the random.org datasets look to be producing more extremes than the UB dataset.
Are the dice rolling sequences of hot/cold rolls?
No.
I didn’t do a poll in Fanatics this time. I think people have caught on at this point.
This is the most difficult to objective measure, and it’s compounded by a relative lack of data. While the previous question does sort of answer this (you’d expect an extreme range to be held over a longer period of time), it doesn’t completely so I decided to come up with a second metric. It’s not a great metric and on its own it wouldn’t pass any kind of analytical test, but it’s enough to give some sort of an indication.
While I had almost 5,600 D6 results, this was only across 863 actual rolls. Add on to this that you need a decent number of dice to say whether something was objectively a hot or cold roll and it reduces the number of rolls significantly.
In the end I arbitrarily decided on a minimum number of 10 dice rolled in a single roll to be able to objectively say that a roll was hot or cold. Completely arbitrary. So sue me.
This gave me a total of 210 dice rolls. Not really enough to definitively draw a conclusion from, but if this theory held any weight then we’d see something (but due to the low results we wouldn’t be able to conclude anything).
I calculate the mean result for each of these rolls and sorted them into quartiles (top 25%, bottom 25%, middle 50%). I then determined how many of those in either the top or bottom quartile had immediately followed another result that was in the same quartile.
In a perfectly average world, 25% of hot rolls would immediately be followed by another hot roll and the same for cold rolls.
The dataset has 11%.
Now we have a big variance to the correct average, which would suggest that if anything UB was having fewer sequential dice rolls than a random number generator, but I refer back to “not enough data”.
The measure also has a problem of not every 10+ dice roll being sequential, some of them even being across games. If we controlled for these issues then we reduce the dataset even further.
Ultimately there’s just not enough data to definitively prove/disprove this one, however if there was anything to this hypothesis then I would expect to see some evidence of it in what data there is, and there just isn’t any.
So with the caveat that I’m basing this on incomplete data, my answer is no. I see no evidence that UB dice rolls are having sequential hot/cold rolls.
So, are UB dice fair?
Yes.
Three of the four main concerns I’ve seen are objectively wrong. The fourth one has no evidence supporting it, and what evidence there is suggests that there is not an issue there.
I’ve asked Kings of War community members, some of whom have said that they believe there is something wrong with UB dice, to pick out a UB dataset from three truly random datasets. They were unable to.
I can find no evidence of bias, extremes or sequential extreme rolls within UB dice.
Why the perception then?
This is where we leave the realm of data analysis and start getting into psychology.
We are all human (except for Tom Annis) and we are all subject to bias. Conscious and subconscious.
Confirmation Bias
The biggest and most obvious one is confirmation bias. We pick up preconceived notions all the time which lead to stereotypes being drawn. When we look at data, we’re more likely to believe or emphasise data that supports our preconceived notions.

It’s human nature and happens all. The. Time.
If you have a string of extreme dice rolls happen in UB (and simply looking at the nerve rolls data shows how much data you need to stop extreme rolls having an impact) then you might start to believe there’s something wrong. Have a few more extreme rolls and it strengthens your conviction. You pay less attention to the rolls that aren’t extreme.
When I was recording data and after the first game dice rolls of 2 were happening far more frequently than others, I started to believe that there could be something wrong. When I was recording the data for the next couple of games, I remembered it every time I wrote a 2 down and had the perception that 2’s were still coming out on top. When I finished and looked at the data, 6’s had actually overtaken. I had been subject to confirmation bias myself.
Compounding this is the bandwagon effect. People jump on bandwagons all the time. If someone starts saying that there’s something wrong with UB dice, then other people start looking out for extreme UB dice. They are then subject to confirmation bias and the bandwagon amplifies.
This is why Data Analysis exists. You look at cold, hard factual data and draw conclusions from it. You remain aware of bias, you’re trained to be impartial and you avoid (as much as is humanly possible) seeking data to support your position and instead look at the data afresh. Half of the job is proving or disproving bias.
Data Presentation
Another factor that I believe is in play is how the data is presented.
We’re not used to seeing dice rolls being presented as a full breakdown. When we roll a batch of dice in real life needing a 4+, we look for the results that are a 4+ and don’t break down how many of those are 4’s, 5’s and 6’s. Equally for misses.
UB gives you that breakdown. You might have a roll where almost all of the misses are 1’s. “Look at that! That’s an extreme roll that!” you might say. Well… no. Not really. You roll those types of “extreme” rolls all the time in real life, but don’t pay much attention because we don’t break down the exact number of each roll.
If UB displayed the results of dice as pure hits & misses then I’m sure people would have a much better perception. Though I don’t think UB should display the results like this for a variety of other reasons, I just think that it would reduce the negative perceptions around dice.
UB dice are more accurate than physical dice
This is a funny one.
UB dice are almost certainly more accurate average than physical dice, however I can’t believe that humans can reliably perceive this.
Over the years there have been a number of people who have rolled physical dice many times over and recorded the results. Surprise, surprise – they aren’t as uniformly average as you’d hope.
That’s how I roll is a a popular example on DakkaDakka, and there are similar articles if you search for them. They all conclude that actual physical dice that we use in wargaming have biases and are not uniformly average. This can be due to manufacturing defects, weight issues in the design and any number of other factors that reduce the precision of the dice we use.
That’s How I Roll concluded that Chessex and GW dice roll one’s 29% of the time, far more than the UB dice (and random number generators) do. This means that other rolls will be off as well – especially 6’s.
Now this certainly isn’t any kind of an argument for using any kind of digital dice app to get more accurate dice- that’s a whole other problem that far exceeds the natural bias in physical dice. It’s also not an argument to use casino dice (again, my opinion is that these would be problematic).
However, we’re used to our dice rolling a certain way that is actually less accurate than UB dice.
Perhaps this forms part of the perception. Perhaps our collective gut feeling of dice rolls is based on physical dice rolls that are fundamentally flawed? Maybe that’s part of the reason that some people “feel” that UB dice are off. I’m not sure.
Now the simple studies that have been done are far from conclusive. They’ve generally only tested a couple of sets of dice, and not enough to be representative. I mean, no-one wants to roll hundreds of sets of dice millions of times to get reliable data.
So far I’ve seen that the community’s ability to perceive dice rolls is flawed, in that the perceptions of extreme rolls, of sequential rolls etc is not supported by any evidence. If we get that so wrong then I can’t believe that someone would be able to actually perceive the difference between physical dice and a digital dice app.
I don’t believe that this is a factor personally, but it is a possibility.
Conclusion
So, for the final time:
I can find no evidence of bias, extremes or sequential extreme rolls within UB dice.
UB Dice appear to be less biased than physical dice, though not to any level that could be distinguishable by human perception.
Again, the dataset supporting this article can be downloaded here.
